A Local View of the Covid Death Toll
Meaningful patterns emerge from examining local Covid data.
For over two years now, a variety of Covid dashboards have been the source of daily news about the pandemic: John Hopkins for the world, NY Times for the US, LA Times for California, SF Chronicle for the Bay Area and Press Democrat for Sonoma County. The County of Sonoma government provides its own Covid-19 Case Data.
Note: The screen shots of charts and totals used in this article reflect the data as of May 17th. The data also varies slightly by source depending on how frequently it is updated.
The US passed over a million mark in deaths due to Covid this week, a shocking number that reflects a pandemic that has lasted over 26 months and is not over. About 92,000 deaths occurred in California, the highest toll of any state but also the most populous state.
The number of deaths in Sonoma County remains relatively small and steady at 491. The total is up one since last week. How many of those deaths occurred in Sebastopol and West County? Or in Bodega Bay or Monte Rio? Unfortunately, the Sonoma County Health Department does not provide data by zip code for Covid deaths. The Department is selective in what data it provides by zip code, as one can get data for vaccinations and active cases by zip code but not deaths. Yet, by looking at the data that is provided, some local patterns emerge.
If you want some relatively good news, it is that at least 96% of the people who got Covid in Sonoma County recovered. The 491 fatalities is 0.6% of all cases, which is the ratio of fatalities to cases. In the US, that ratio is 1.21%. In California, it’s 0.97%, according to data from Johns Hopkins.
One of 5 Sonoma County residents has tested positive for Covid.
The Elderly were 75% of Local Covid Deaths
This could be the headline of its own Covid story for Sonoma County.
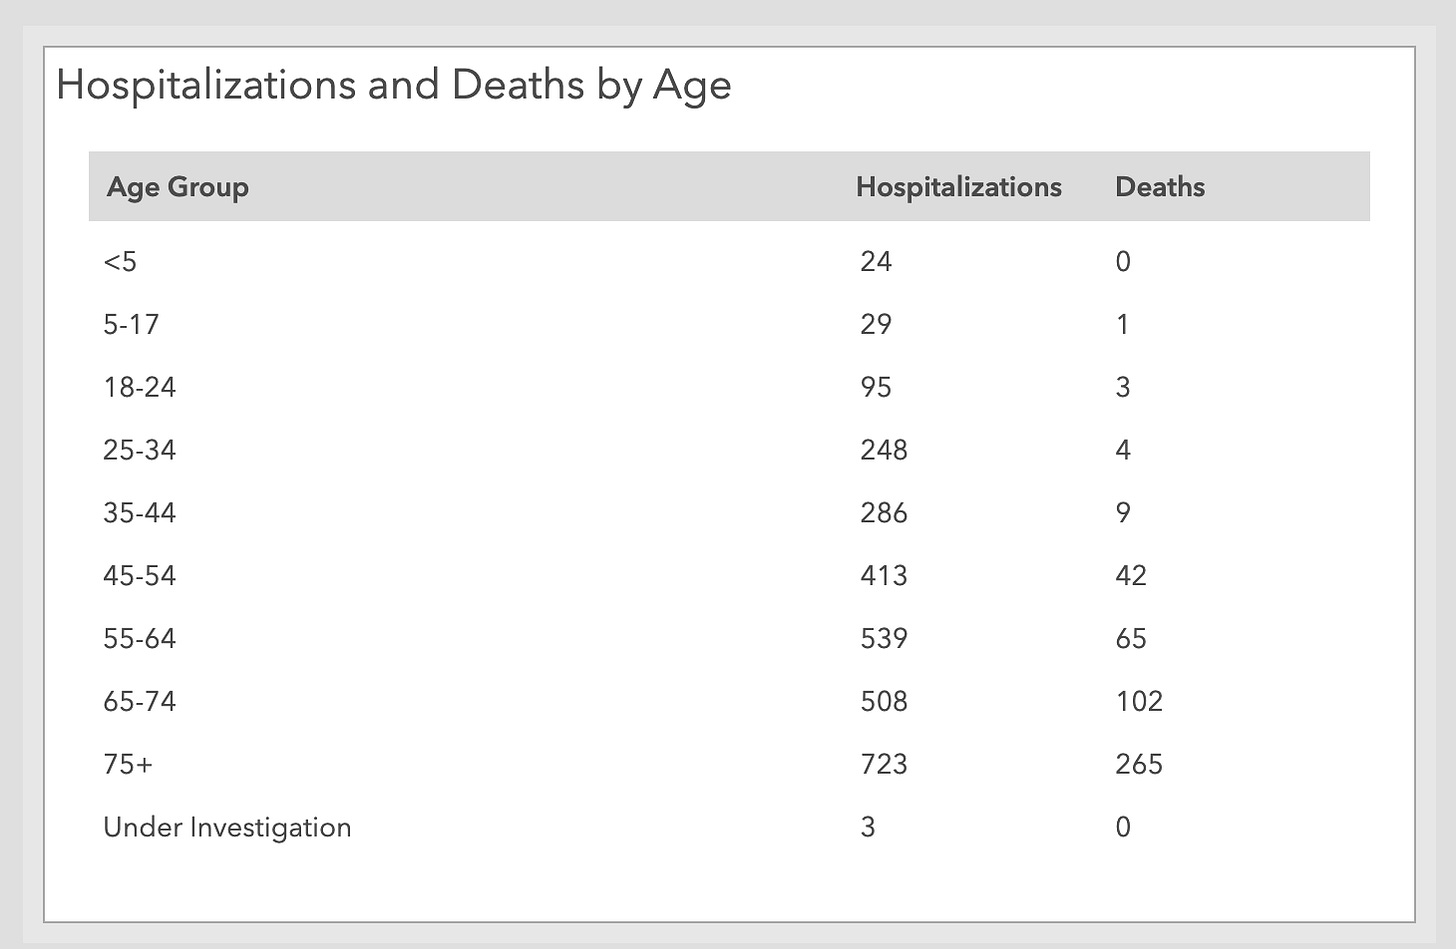
In Sonoma County, the elderly (65 and over) represented 10% of total cases but almost 75% of all deaths — that is, 367 of the 491 who died were 65 or older, as shown in the chart above. 107 people between 45 and 64 years of age died of Covid. Only 17 people under the age of 35 died of Covid.
Those living in a Skilled Nursing Facility or a Residential Care Facility for the Elderly accounted for 181 of the deaths or 39%. For perspective, one in 5 residents in Sonoma County is 65 or over, roughly 92,000 people or 18% of the population. We could say that 75% of all deaths occurred in less than 20% of the people in this one demographic segment in Sonoma County, a fact that hasn’t gotten nearly enough attention.
The NYT reported in June 1, 2021 that residents of nursing homes accounted for 31% of all US deaths but only 4% of all cases. (It has not maintained this page since then.) In California, according to data from the LA Times, nursing homes have accounted for 2% the state's coronavirus cases, but 13% of its deaths — 9,716 deaths.
Sonoma County appears to have fared worse than the state or national average. Covid-19 Nursing Home data, accessible via data.cms.gov, which is based on self-reporting from nursing homes, does provide a database of reports from individual nursing homes.
For instance, Apple Valley Nursing Home in Sebastopol reported on May 1, 2022 a total of 19 Covidcases among residents and 53 among staff but there were no deaths due to Covid. A review of 18 nursing homes listed in the CMS data shows a reporting of 80 resident deaths and 1 staff death. There must also be other facilities that care for the elderly that are not part of this report.
Covid Peaks
Looking back over 26 months of Covid, there’s an interesting pattern seen in the three charts below from Johns Hopkins. More deaths occurred before the vaccine became available but a lot more cases developed even a year after the vaccine was widely distributed, spiking in early January 2022.

One possible complicating factor is that the lack of testing in the first year of the pandemic probably reduced the number of positive cases reported. The rise in cases in 2022 coincides with increased availability of testing.
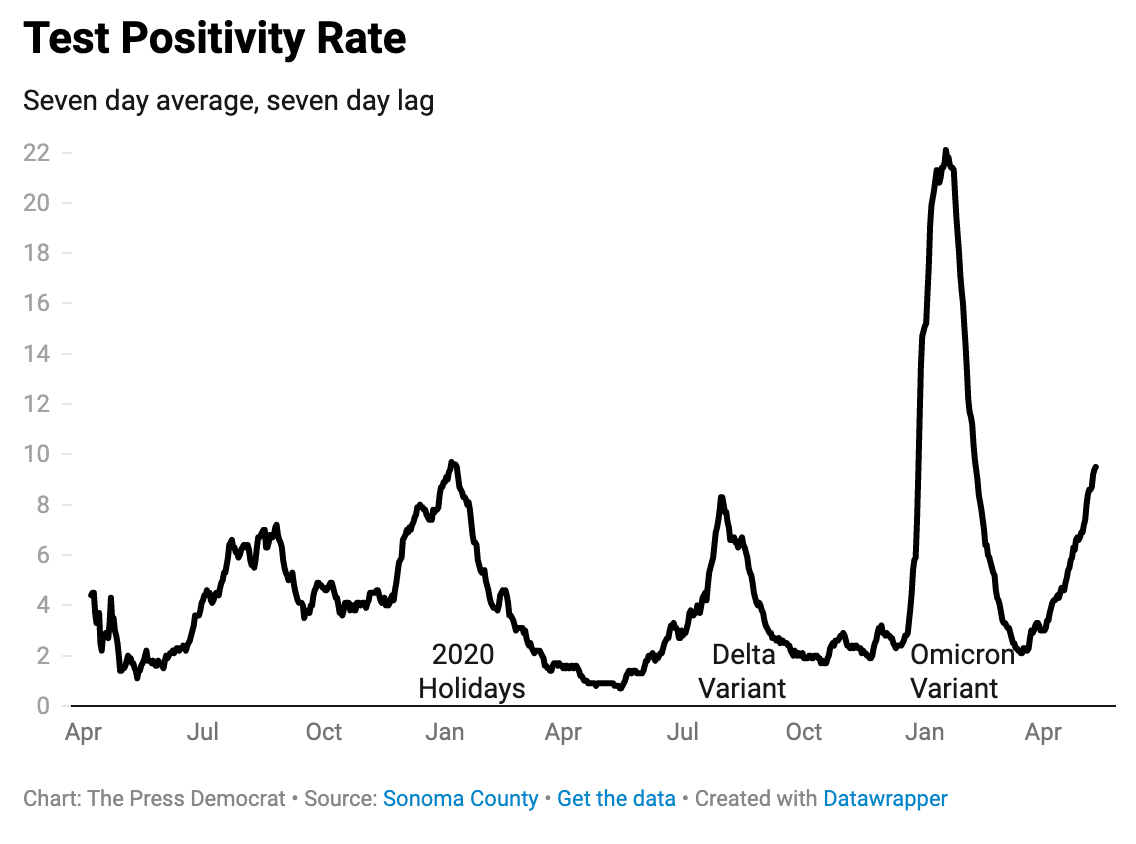
This pattern bears out in Sonoma County data with deaths coming earlier in the pandemic but the number of active cases peaking more recently. You can see that there were more deaths at the end of 2020 through the first quarter of 2021.
The highest number of Covid cases in Sonoma County (and in the US) was from early in 2022 with the Omicron variant, as the chart above shows. A sign that COVID is far from over is the uptick in the number of cases over the last month or so. According to the LA Times, “the state has averaged 10,124 new cases, an increase of 43.8% compared to two weeks ago” but the 262 deaths in California are 13.5% less than two weeks ago. Anecdotally, there seems to be more people getting Covid as they drop their protocols but the consequences from getting Covid seem less severe for most because they are vaccinated.
Sebastopol and West County Deaths
Coming back to the question of how might we estimate the number of deaths in Sebastopol West County, we can look at two methods of estimating: Sebastopol West area represents 6.9% of the population of Sonoma County. If the the number of deaths were equally distributed in the county, then 6.9% of 491 gives us 33.8 deaths in West County. Sebastopol alone accounts for 3% of the total cases in Sonoma County. 2739 is 3% of 91316 cases. Apply 3% to 491 and the answer is 14.7. A rough estimate then is that somewhere between 14 and 33 deaths due to Covid occurred in Sebastopol and West County.
These are only estimates and they are approximate, not authoritative. When or if the County Health Department decides to share more data based on zip codes, we can interpret actual data.
The County Health Department provides information on active cases by zip code. There is an interactive map from which the top image with Sebastopol data was taken from. In the chart below, which ranks active cases by zip code, 95492 is Windsor, which leads the list, followed by two Santa Rosa zip codes and then Kenwood. At the bottom of the list is Fulton and Bodega Bay. These “rankings” do change week to week.
Numbers do not tell the whole story of Covid. Nor does the Covid death toll fully explain the impact on lives in our community. For example, there were 310 lives lost in Sonoma County in the wars of the 20th century. The Covid numbers offer the sober perspective that the elderly were the most vulnerable to Covid and this impact extends to the families who lost loved ones.
We’d love to hear your perspective on how Covid impacted you and your family.


