

This is part one of a multi-part series examining the data on local public schools—and what it tells us about the quality of public schools in our county and how well students are learning. These articles will be available under the “SoCo Schools” section on the Sebastopol Times website.
If a friend asked you, “How are the public schools in Sonoma County?” what would you say? For many families, this question shapes where they choose to live, how they plan for their children’s education, and how they feel about their community as a whole.
Parents today face a very different landscape than even 10 years ago. Sonoma County now offers traditional public schools, magnets, charters, dual-language programs, independent study, and private options—a mix that can feel overwhelming without clear information.
This report aims to give parents a straightforward look at how students in public schools are doing academically, using the State’s own scorecard: CAASPP “Smarter Balanced” standardized tests. Testing doesn’t tell the whole story—but it reveals important trends that families should understand.
What Test Scores Can—and Cannot—Tell You
At a Starbucks in West Santa Rosa, I met with Gabe Albavera, the former principal of Elsie Allen High School and now principal at Roseland University Prep, a charter school. We talked through the county’s test score rankings.
As we talked, a teenager walked up, tapped him gently on the shoulder, and nodded, saying “hey” without actually saying it in words. Mr. Albavera responded, smiling back at the young man and asking him how he was doing. “Good,” said the young man, hanging for a minute until his drink was ready at the counter.
“He’s one of my students,” Mr. Albavera said, proudly. The trust and warmth between them were obvious. Mr. Albavera said that working with kids was why he went into education. He said that this kind of relationship—an adult who knows your child, listens, and intervenes when needed—is very important. And it isn’t measured on any test.
Still, basic academic skills matter—reading, writing, and math.
For more than 20 years, California has relied on standardized tests to measure how well students are learning. These tests are called Smarter Balanced Summative Assessments and go by the acronym CAASPP (pronounced CASP). The State of California Department of Education has spent hundreds of millions of dollars with Educational Testing Service (ETS) on testing students each year.
Students take the “Smarter Balanced” test each spring in grades 3–8 and 11.
Scores fall into four categories:
Exceeded Standard
Met Standard
Nearly Met
Not Met
The top two can be combined into one group, Met, while the bottom two can be grouped into “Not Met.”
The scores for public schools in Sonoma County show most students not meeting the basic requirements in English Language Arts (ELA) and Math. That’s also true across the state. Education officials say that the scores are marginally better than the previous year, but the scores are actually pretty low. They are not only low; they are stagnant and not changing very much.
California Statewide CAASPP Results (2025)
There are 5.8 million students in California public schools at all levels from TK through 12th grade. Here are the statewide results for all grades and all schools for English Language Arts (ELA) and Math.
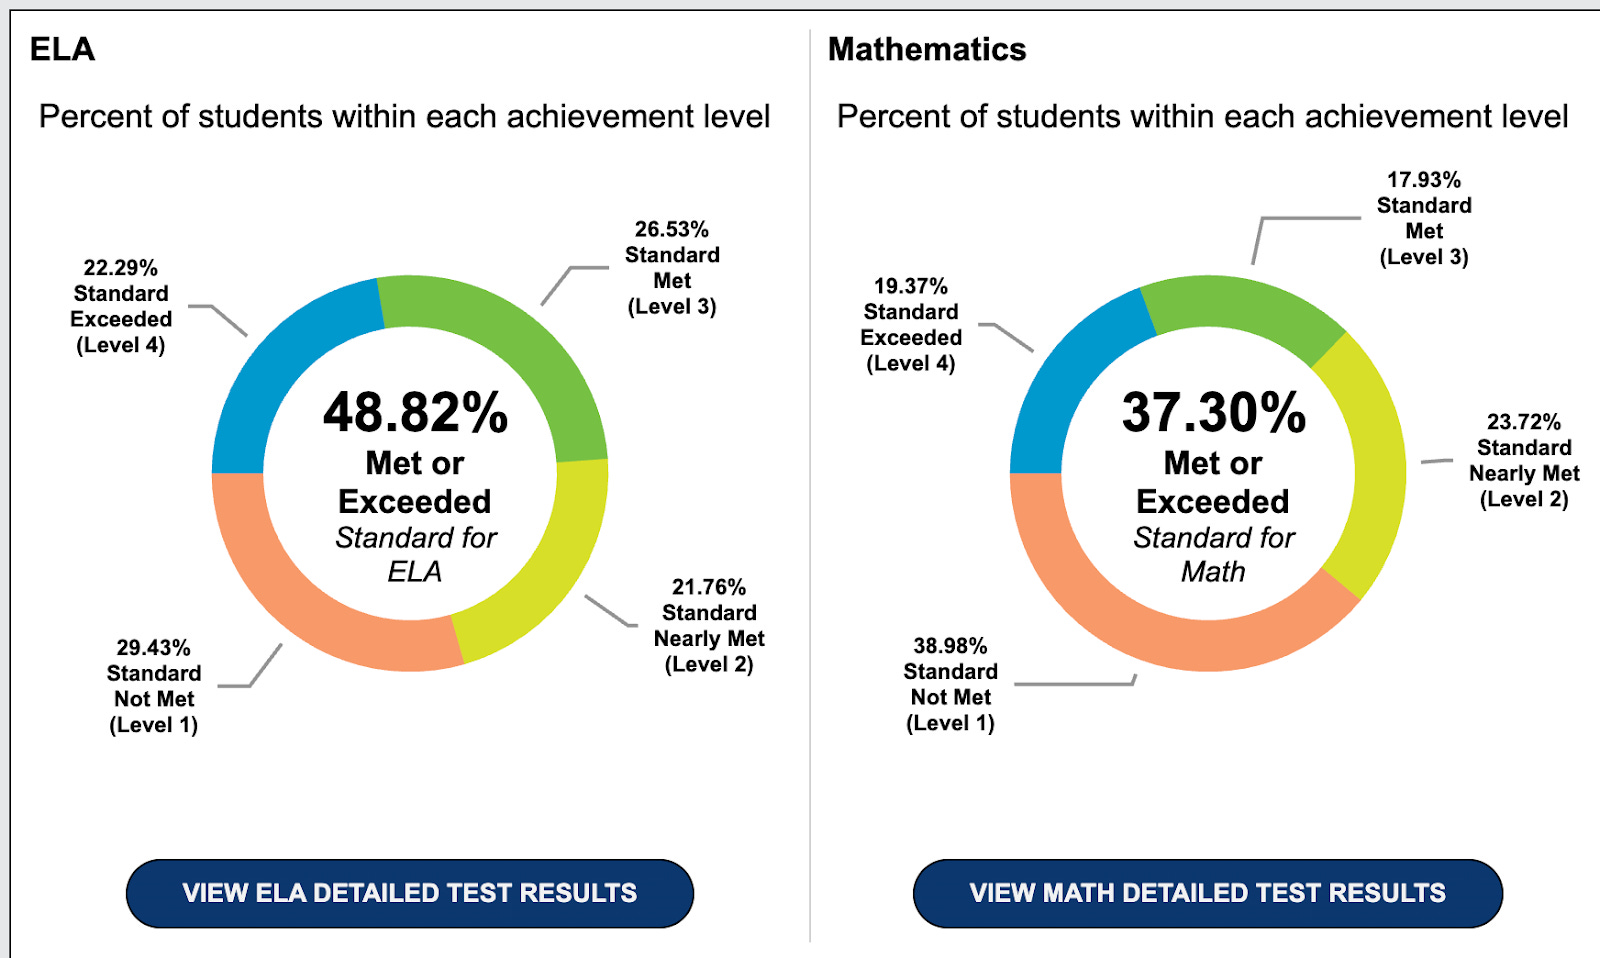
Look at the bottom half of the segmented circle in the graphic, not just the top half. If 49% of the students are meeting the standard in English, there are 51% of students who are not. In Math, it’s 37/63. We’ll use this Met/Not Met breakdown for individual schools as a shorthand using rounded numbers. Here are two takeaways:
Half of all California students are not reading or writing at grade level.
Nearly two-thirds are behind in math.
In the press release from the Department of Education announcing the results, the State’s educational leaders say that the test results:
“…show continued progress made by K–12 students in California, including further movement to close equity gaps for socioeconomically disadvantaged students, Black/African American students, and Hispanic/Latino students.”
It added that student scores “showed modest increases at a higher rate than the year prior, suggesting growing momentum.”
Momentum is hard to see in this chart (from EdSource) of the ELA scores over ten years.
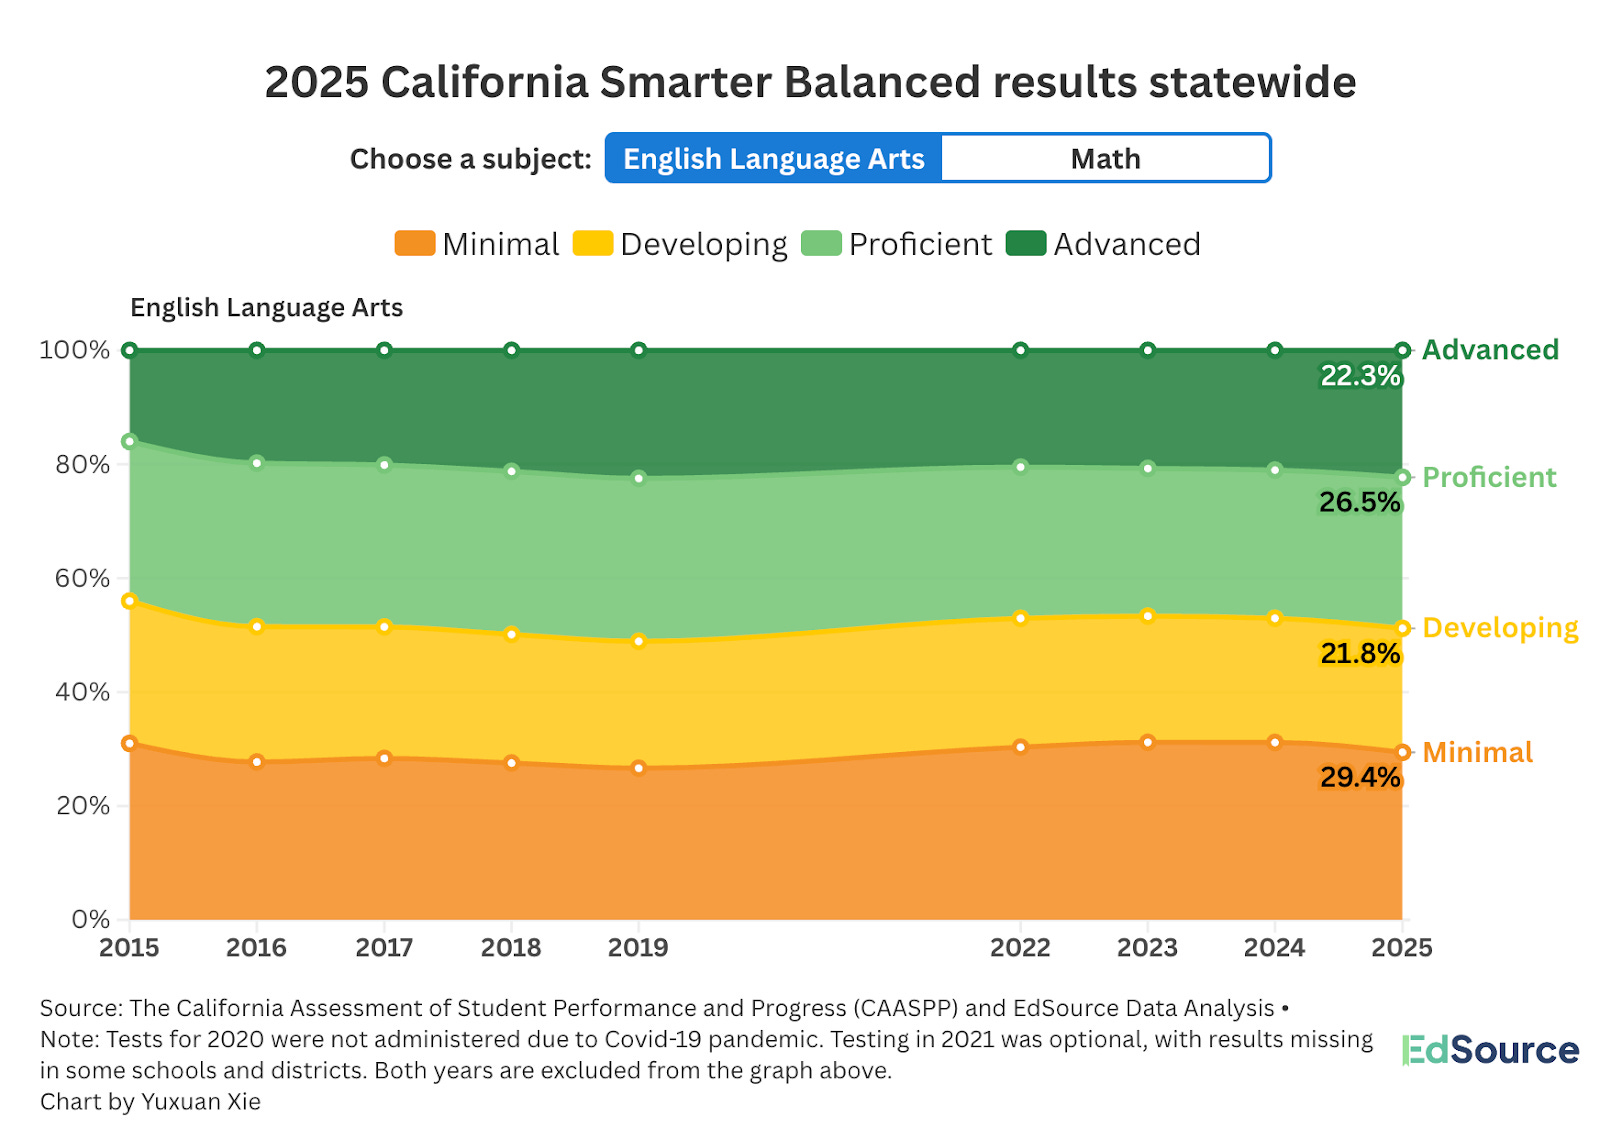
The ten-year view clearly shows the same pattern before and after Covid. Here are the statewide results for Math over ten years.
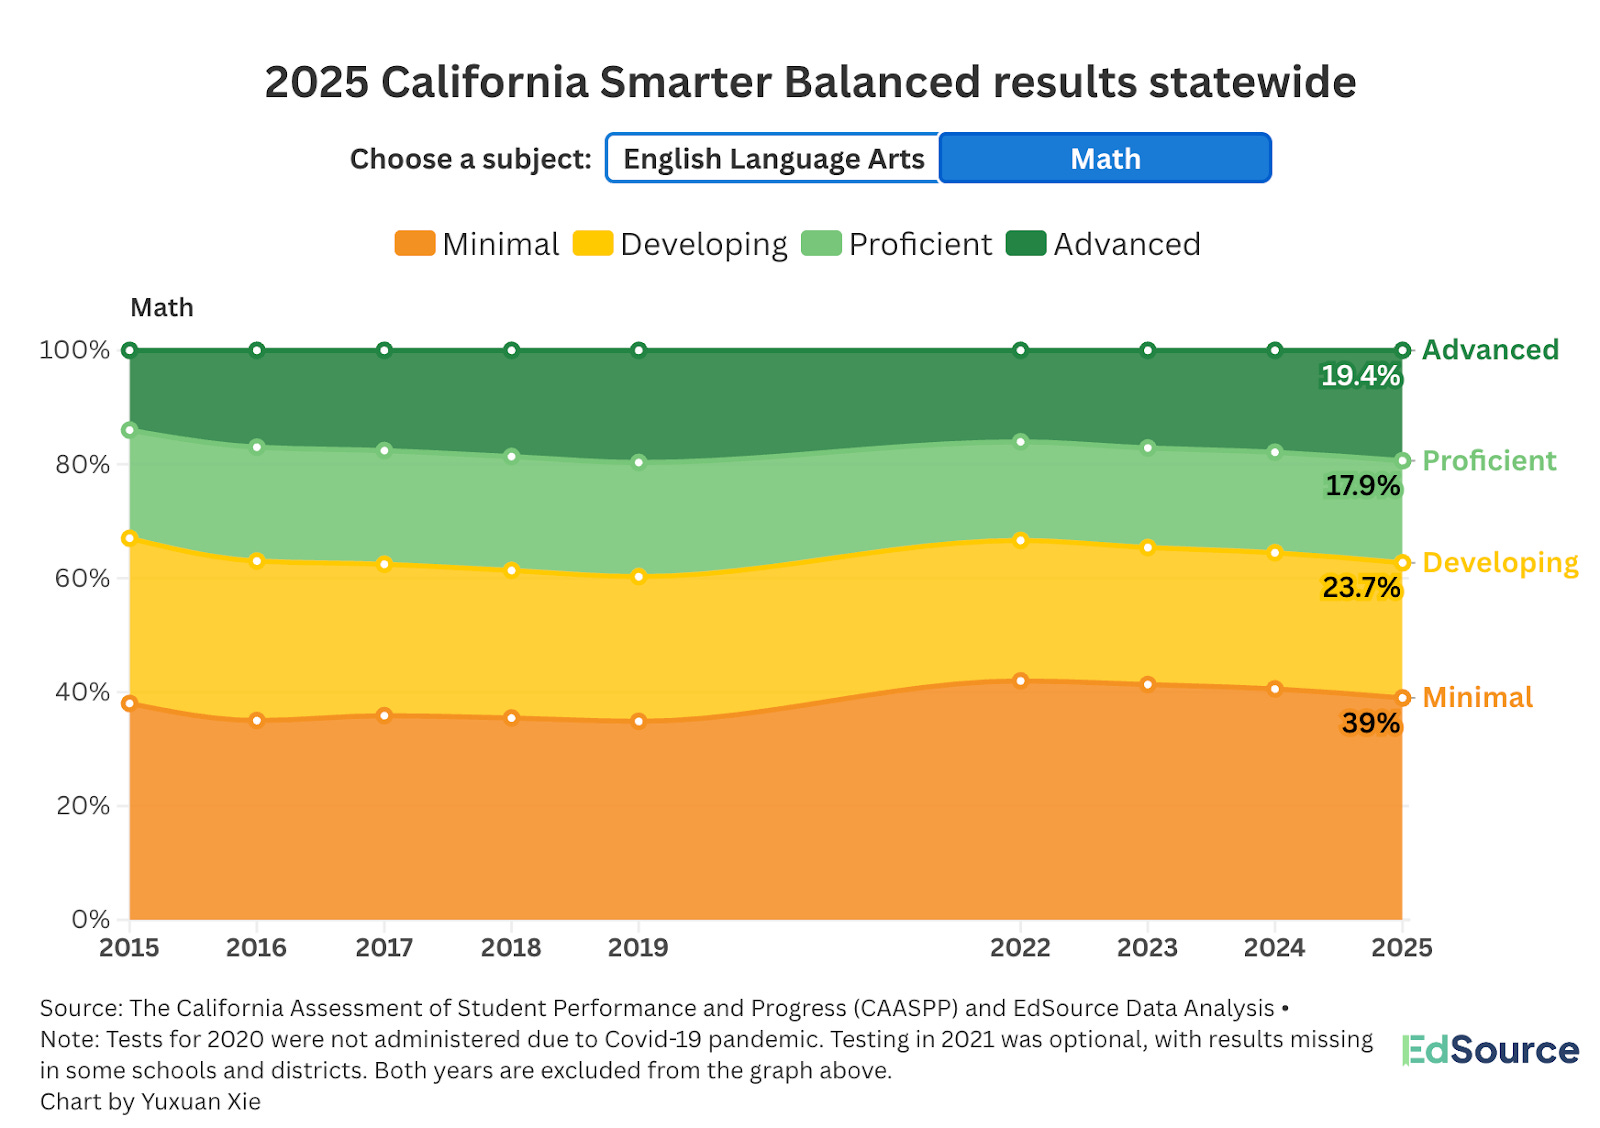
Not much has changed for ten years or longer. These stagnant levels are the status quo. Yet the state education administration thinks they are making “good progress” on equity and “closing gaps.” They are not.
One measure that State officials openly applaud instead of test scores is the graduation rate, which is up to 87.5% on average. If you want one takeaway from this series, it’s this: test scores show more students are not meeting the State’s basic standards, yet the graduation rate is up. I heard the phrase “get a ‘D’ and you get a degree.” Graduation is a certificate of completion, not achievement. Add in grade inflation and many say that GPA can no longer be trusted as an indicator of student performance.
Also, students who are meeting or exceeding standards, many of them college-bound, may not be doing as well as it seems. A November 2025 report from UC San Diego’s Faculty Senate points out the academic deficiencies in first-year students:
Over the past five years, UC San Diego has experienced a steep decline in the academic preparation of its entering first-year students—particularly in mathematics, but also in writing and language skills. Between 2020 and 2025, the number of students whose math skills fall below high school level increased nearly thirtyfold; moreover, 70% of those students fall below middle school levels, reaching roughly one in twelve members of the entering cohort.
In elementary grades, many students are promoted from the elementary school without having achieved grade level proficiency in English and Math, and then they are promoted in eighth grade with a larger deficit. These students enter high school, burdened with this extra baggage.
How are so many students graduating without meeting academic standards?
Does GPA still mean what parents think it means?
What are the outcomes for students who graduate without these skills?
Sonoma County: How Do Local Students Perform?
Sonoma County has 64,798 public school students. When we look at their test results, the picture is concerning.
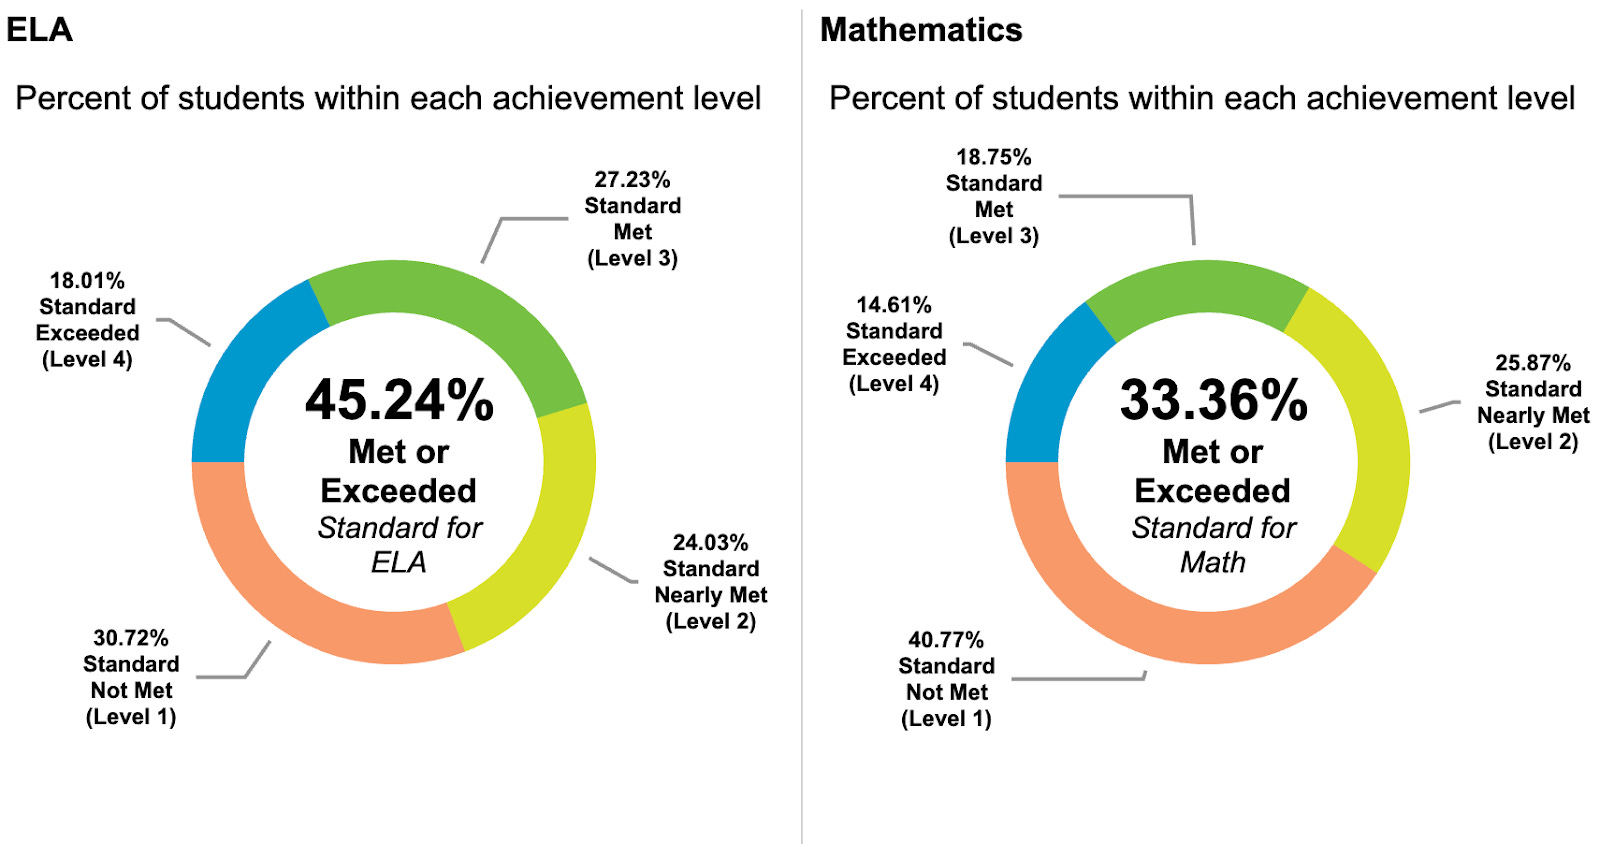
Sonoma County performs below the statewide average in both subjects.
This might surprise many parents who assume that Sonoma County—wealthy, well-resourced, and known for community involvement—would outperform the state. It does not. Look at how large the orange segment is — 31% of the students are not close to meeting the English requirements and 41% of the students are not close to meeting the Math requirement. These are students who, according to the State, show “minimal grade-level knowledge and skills.”
An old business school maxim, attributed to Peter Drucker, is “what gets measured gets improved” but that hasn’t proven true in California.
Talking to educators, many cite problems with what gets measured. The test for 11th graders in the spring covers material from three years of math courses. A principal told me that his high school only requires two years of math and most students take those courses in their first two years, so they are being tested on a subject they haven’t taken for a year. At other schools, students who struggle with math take remedial math, and none of them will cover all the material in school that’s on the test. So, there’s a mismatch between what students are taught and what they are tested on.
I also heard from teachers that students are not motivated to take the standardized tests. Students don’t “get” anything by taking the test, so why try? The results don’t count against their grade or graduation. Some schools make the effort to provide rewards for students to try harder and improve the school’s results. Nonetheless, that the State does not consider student motivation as a factor tells you a lot about the education system.
California’s Democrat politicians seem satisfied with the status quo. “We’re working to provide students with the resources they need to succeed. And California’s increasing test scores show our efforts are paying off,” said Governor Gavin Newsom upon the release of the CAASPP scores.
Standardized testing goes back to No Child Left Behind, the federal program for “accountability” that started under President George W. Bush and continued through President Obama and lives on in one form or another to this day, even as President Trump works to dismantle the Federal Department of Education. The promise was that standardized testing would identify poor performing schools and then those schools could be fixed or shut down. It would also provide justification for bipartisan education funding if the tests showed that money spent on education was achieving its intended results. The promise of accountability seems forgotten today but schools, including teachers and students, must follow this annual ritual of standardized testing.
Mr. Albavera said that when test scores came out at Elsie Allen High School at the beginning of the new school year, the teachers and staff felt discouraged. The low academic performance of the school hurt morale of the faculty and students. He knew that test scores didn’t tell the whole story but what is the story? He remained focused on the positive relationships he forged with his students, based in trust and mutual respect. He saw this as an essential support for student success, no matter how hard it was to measure.
In the next article in this series, we will look at the data for high schools in Sonoma County.
Sources
The sources listed below can be used to research any school or district and learn more about the academic performance of students. However, it’s harder to compare one school against another or on a countywide level. That’s the goal of this report.
CAASPP (standardized tests in ELA and Math and Science). In early October, the standardized test scores for the state were released HERE. Students were tested in the spring of 2025 in grades 3-8 and 11th grade.
EdSource publishes a useful view of the same CAASPP results HERE.
The State School Dashboard was released HERE in November. Its color-coded graphics look like those that rate fire danger.
DataQuest provides detailed reports on schools such as enrollment by school.
If you have experience working in Sonoma County Schools or ideas on how to improve them, please write me - dale.dougherty@gmail.com.
These crazy Marxist Teachers all need to be fired immediately. Poisoning the minds of Sonoma County children. If all intelligent people show up at the next local board meetings and demand they teach about the God-given rights we’re all born with, to which the Constitution refers, and teach the Constitution and the Godly principles like faith and courage and fearlessness and humility, upon which this nation was founded.
To the America Haters reading this comment, there was good and bad, about the Founders - teach it all. It was a different time in the world, with worldwide slavery and women had no rights yet, but the Christian men who founded this nation knew they had a right to freedom and freedom from tyranny and were willing to risk their very lives and fight for it. Which they did.
Today’s Americans appear so afraid of this tyrannical government that they not only refuse to fight for our rights and freedom but are even afraid to talk about it!
That’s what public schools have done to American children, though not ALL American children. I, for one, am not afraid to exercise my First Amendment right to speak freely. We’re not ALL afraid, but many Americans suffer from a form of Stockholm Syndrome, so afraid of this nation’s tyrants that they actually SUPPORT their freedom being taken from them, and support this nation’s terrorist Tyrants who clearly are not “of the people, for the people” or “by the people”.
It’s time for brave Americans to stand up for ourselves and exercise our God-given rights, for a change. We can start at these local School Board meetings. I’ll be attending as many as possible now. I hope to see many of you there, too. We can make schools American again. We can identify and demand the Board’s fire the Communists and the Marxist ‘educators’ and ‘teachers’ and go back to teaching American principles and values, like how to develop a good work ethic, speak up for yourself, have faith, be brave and courageous, how to be strong and independent and build your OWN business, not work for the tyrants and make the tyrants rich, like many of us were conned into doing.
I hope many of you will consider showing up at your local School Board meetings too, even if you have no children or grandchildren attending right now. “The only thing necessary for the triumph of evil is that good men (and women) do nothing.” Edmund Burke
Copied from Facebook
Great!
At last someone is showing concern over what I would say is mediocre to poor performance by local schools. May I add this to the discussion? 1. It's not that the students are not aware of the mediocre to poor preparation they are receiving. In a 2023 survey, 24% of Analy (and Laguna?) students thought their high school experience prepared them well for college or post high school careers. And this low percentage ranked in the bottom quarter of all schools nationally. (When I read about this result [in the Sebastopol Times] I was astonished at the lack of community concern. I mean - only 24% of students think their high school is preparing them well!! 2. Despite a median family income ranking well above the State level, (using family income as a surrogate for socio-economic status, a commonly accepted indicator for academic proficiency), Sonoma County has an acceptance rate at California State Colleges and Universities below the statewide level.
Tough decisions to make. And what was the last price tag I saw for improvements needed for the Analy campus? >$40 million?