
Part 2: The High and Lows of Local High Schools
Comparing the standardized test scores of comprehensive public high schools and charter high schools in Sonoma County

In Part 1 of SoCo Schools, we looked at Statewide and Countywide results from standardized testing, but these averages don’t tell us how students at any particular school are doing. In Part 2 of this report, we will examine Sonoma County high schools and their test results. To be honest, this article is just a plain look at the data itself without much exploration of what the results mean. In Part 3, we will begin to look more in-depth at three high schools.
The State’s standardized tests for ELA (English Language Arts) and Math are administered for high school students near the end of the 11th grade. CAASPP or Smarter Balanced standardized tests were explained in Part 1.
The CAASPP results for an individual school are shown in the graphic below:
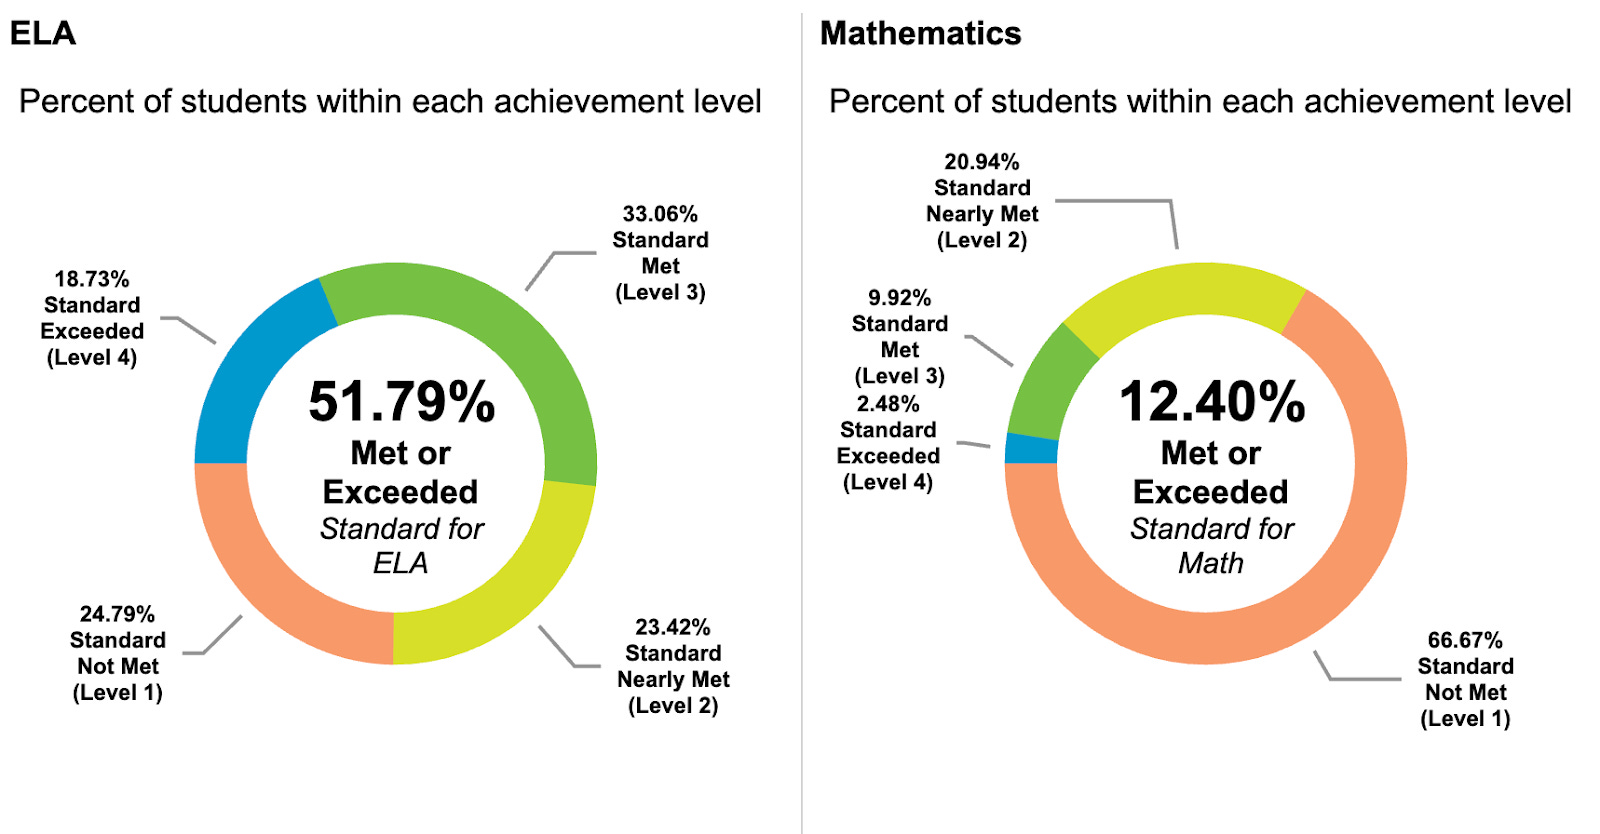
The number in the center combines the percentages for blue and green segments on the circle — 51.79% for ELA and 12.40% for Math for this school. What should also draw your attention are the percentages for orange and yellow — those who did not meet the standard. When they are combined and rounded for this school, we get 48% in ELA and 88% in Math not meeting the requirements. We’ll be using “% met / % not met” as a simplified view of these results, such as 52/48 for ELA and 12/88 in this example. In addition, the large, orange segment is the most concerning, as it represents students with “minimal knowledge and skills” in that area. For Math at this particular school, two-thirds of the students are at this lowest level.
We will also be using the California School Dashboard, which provides a graphic representation of the scores but doesn’t provide the actual met/not met percentages. Here’s a portion of the dashboard representing the same school’s scores as shown above — yellow for ELA and red for Math.
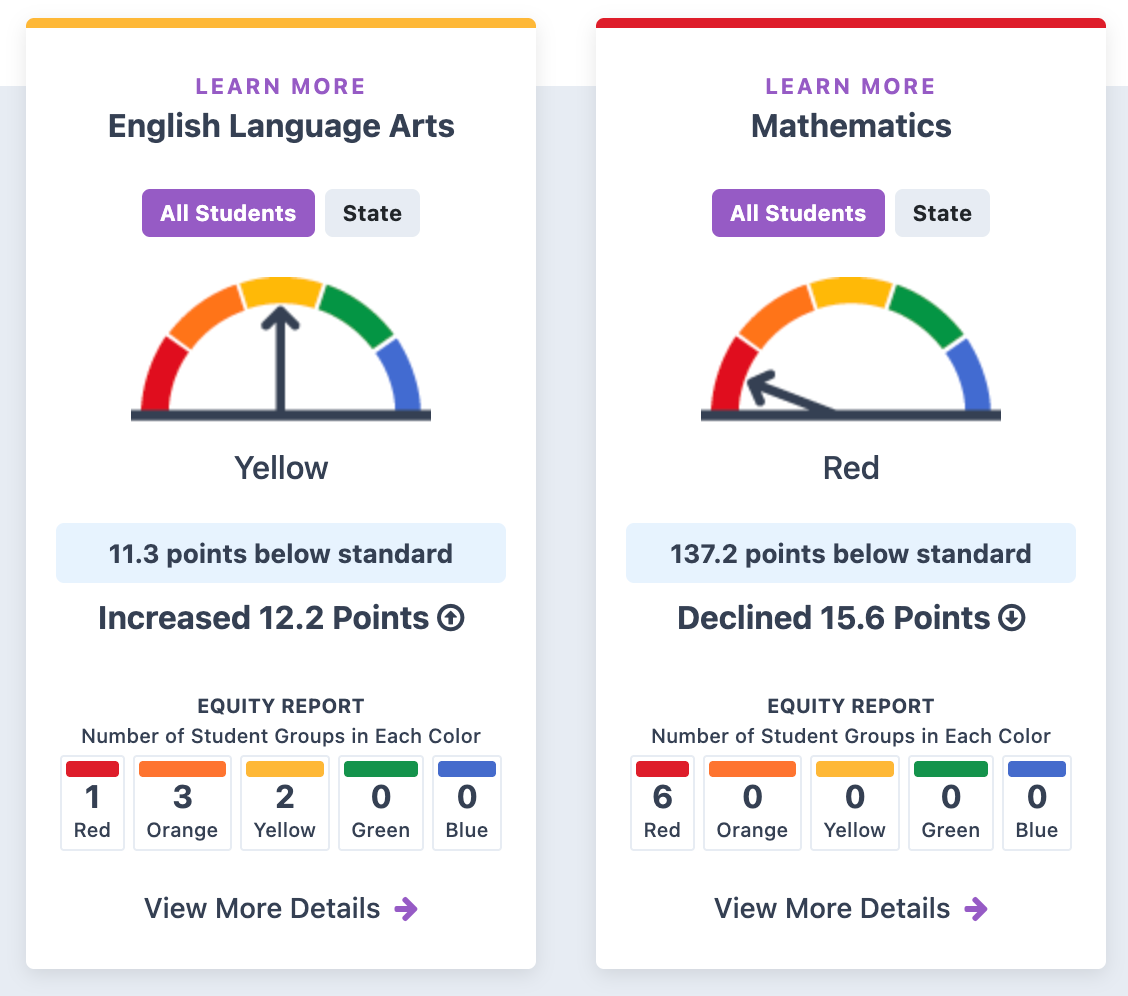
The dashboard does indicate whether the scores were up or down compared to the previous year. It also tells indicate how different student groups are doing. There is more information on the school such as its graduation rate and enrollment.
Both the CAASPP site and the California School Dashboard are useful to learn about a school or schools within a district. It’s hard, however, to compare test scores of schools across the county using these tools and that’s what the information in this report allows you to do.
Comprehensive High Schools
There are 13 comprehensive high schools in Sonoma County. These are schools that take everyone regardless of ability or background, which create a variety of challenges. They typically have an academic program and AP classes that prepare students for college along with Career & Technical education programs that prepare students for the world of work. They usually have robust athletic, music and art programs.
These schools are the largest by enrollment in the K-12 system. Cloverdale High and Healdsburg High are the smallest with 500 students or less. The largest are Rancho Cotate High and Windsor High with over 1,700 students each.
Here is a listing of the schools ranked by the size of enrollment. Each high school listing states the percentage of students who are Socioeconomically Disadvantaged (defined here) as well as the percentage of students graduating, both rounded. (These three pieces of information come from the School Dashboard.)
With the exception of Elsie Allen High School, all of these high schools graduate over 90 per cent of their students, the one measurement that the State tracks closely. Schools with a higher percentage of students who are classified as Socioeconomically Disadvantaged generally have lower scores on standardized tests but we will dig more deeply into that correlation in a future installment.
Schools not on the list:
Geyserville New Tech Academy has around 100 students in grades 6-12 but too few students take the 11th grade test to report on the results.
The listing does not include continuation schools that consist of 11th and 12th graders.
These are public high schools not private schools, which do not have to take these tests.
We will look at charters and other public options separately below.
Comprehensive High School Test Scores
Here are the comprehensive high schools ranked by ELA scores followed by Math scores. The number in blue represents the percentage of students who met the requirements and the number in orange represents the percentage of students who did not. The two charts allow us to compare relative performance among the high schools.
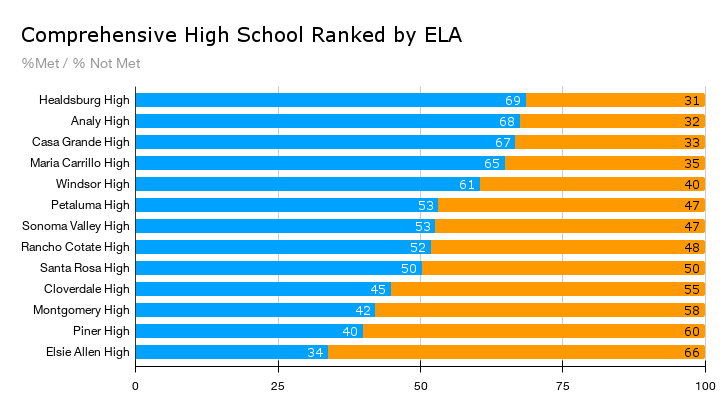
Healdsburg High is at the top of the ELA results; it’s a school that is one-half to one-third the size of the larger comprehensive high schools. Analy is second. Casa Grande and Maria Carrillo are separated by only a point or two from the others at the top with Windsor to follow. Santa Rosa City schools (Santa Rosa High, Montgomery, Piner and Elsie Allen) occupy 4 of the bottom five slots.
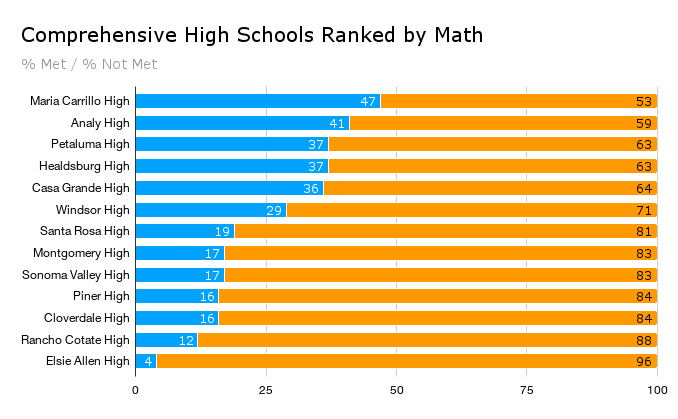
For Math, we see a lot more orange than blue. Santa Rosa City Schools District have Maria Carrillo High with the highest score, but also Elsie Allen with the lowest score. Three other high schools in the SRCS district (Santa Rosa High, Montgomery and Piner) are in the bottom half, joined by Elsie Allen. The two Petaluma schools (Petaluma and Casa Grande) are separated by only a point.
Public Charters and Other Options
This group of high schools are as different from each another as they are from comprehensive public high schools. Several are independent public charters, including Credo, Pathways, and Northwest Prep Charter. Technology High in Rohnert Park is like a charter but it’s technically a magnet school. Roseland Prep operates as a dependent charter within the Roseland District but its size makes it look like a comprehensive high school.
In addition, homeschooling and/or online schools are a big part of Sonoma County’s educational landscape. Some of the Charters aim at supporting students who are homeschooled and many work with students in all K-12 grades. Pathways in Rohnert Park and Orchard View provide independent study and some on-site instruction and guidance. California Virtual Academy is an online school, supposedly a non-profit but owned by Stride, Inc, formerly K12.com. California Pacific Charter is also a non-profit organization with three schools in California. Pivot Charter is part of a chain of schools that combine some on-site counseling with online courses.
The State doesn’t report on the number of homeschoolers, if it even keeps track, but some think that 8.5% of students in California are homeschooled.
Here are nine charter high schools, listed by enrollment. Some districts hold the charter for schools that operate outside their district, such as Pathways Charter in Rohnert Park, which is under the Harmony Area School District in Occidental, and Pivot Charter in Santa Rosa, which is under Oak Grove School District in Graton.
Note that with the exception of Roseland, these schools have a much smaller student body, another reason some students and families are attracted to them.
Here are the schools ranked by ELA and Math percentages.
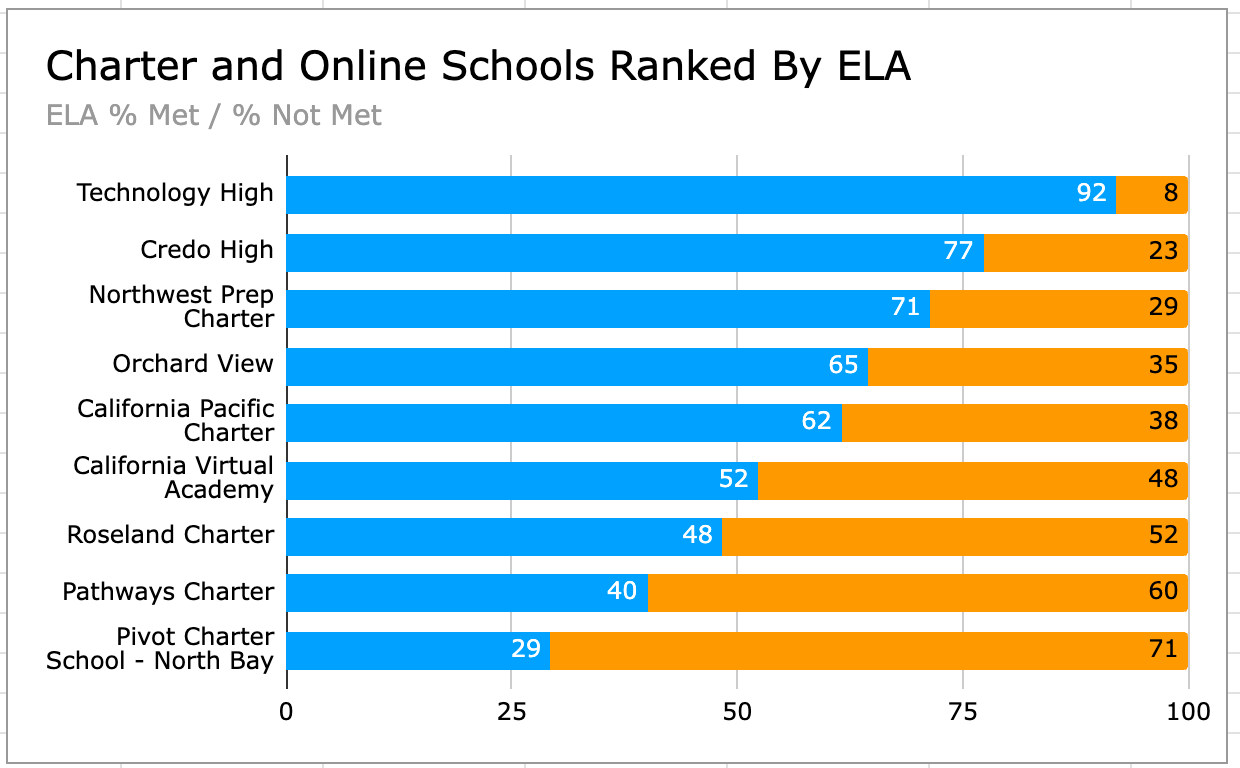
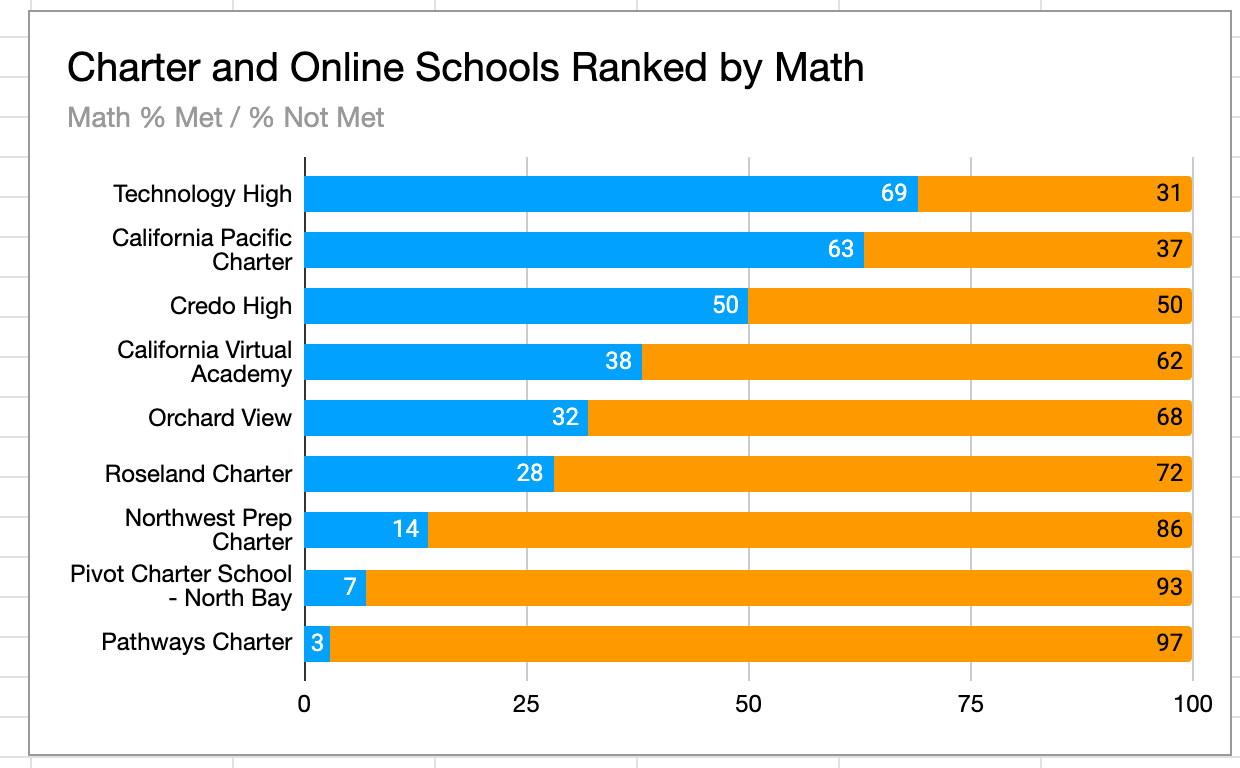
Technology High has the highest scores in ELA and Math in the county, not just among charters and online schools. The two low performing schools in Math are Pivot and Pathways. Some charters do well on standardized tests and others do not but one could say that charters generally have higher scores than the larger high schools.
The one thing to keep in mind about charters and online schools is that their student body is a product of choice. Students and their families make a choice to attend these schools and these schools may use a lottery to determine who is accepted.
Parents often choose these schools for a variety of reasons, including its reputation, interest in a specialized program or dissatisfaction with a current school. Charters, online schools and homeschooling have introduced a broader set of options for parents to choose from while also contributing to declining enrollment in traditional schools.
Parents might also choose a public high school outside the district where they live for the same reason that others choose charter schools or private schools. One district’s loss is another district’s gain. We’ll be looking at inter district transfers in a future installment.
50/50
The CAASPP scores might be considered a report card for the State’s public education system and its schools. The State sets the standards, the rules and the requirements; controls most of the funding, collects and distributes it; develops the testing regimen and reports on the quality of the products of its system. The scores say less about the students who are being tested and more about the system itself and its effectiveness.
One might assume that 50/50 — where 50% of the students at a school are meeting the standard and 50% are below the standard — would be a minimum level for schools in Sonoma County. The Statewide and Countywide averages, shown in Part 1, were below 50/50. Overall, there are more students are performing at a low level rather than a high level.
In Sonoma County high schools, nine out of thirteen comprehensive high schools and six out of nine charter high schools in Sonoma County are at or above 50/50 for ELA but there are no comprehensive high schools at 50/50 or above in Math. Three out of nine charter high schools are above the 50/50 threshold in Math. The low bar of 50/50 is high for a lot of public high schools in Sonoma County.
More specifically, for the 4400 juniors that were tested in spring of 2025, more than half of those students were not meeting basic requirements and yet 90% on average will graduate in the spring of 2026. No matter what value you place on standardized testing, the combination of low test scores and high graduation rates seems hard to reconcile, especially as these results are related to outcomes for the young people growing up in our community.
While the mission statements for public schools contain language such as: “We empower all students to thrive academically,” solving for “all” is really hard, maybe unrealistic, maybe impossible. These standardized test scores show that the education system is unable to deliver on that promise and perhaps it’s time to face reality.
In Part 3, we’ll look more deeply into a set of three different high schools in Sonoma County. After publishing Part 1, I’ve heard from people who have worked in the system and wanted to share their experiences. Email me if you’d like to share your experience as a parent, teacher or administrator: dale.dougherty@gmail.com.
Great article, highlighting a disturbing trend. I’d recommend an Oct 19th David Brooks article on the same subject. https://www.pressdemocrat.com/2025/10/19/brooks-for-democrats-a-failing-grade-on-schools/ Brooks: For Democrats, a failing grade on schools. Now let’s not make this a lefty righty thing, we are trying to figure out how again, to best education our youth. Brooks points policies that led us stray and some corrective actions being taking in some other states(yes red poor states) that are successful.
In a nut shell, Brooks points out the problems of computers and cell phones and more importantly we change our education approach: “The age of accountability was over; the age of equity was here”.
Here’s a couple quotes from his article:
“In 2015, Congress replaced No Child Left Behind with the Every Student Succeeds Act. The age of accountability was over; the age of equity was here. Under the Every Student Succeeds Act, states no longer had to produce rigorous report cards on how schools were doing. ……. For example, California revised its rating system, and magically, nearly 80% of its schools were ranked as medium- or high-performing.
When it comes to education policy, Republicans are kicking Democrats in the butt. Schools in blue states such as California, Oregon and Washington are languishing, but schools in red states including Mississippi, Alabama, Tennessee and Louisiana, traditional laggards, are suddenly doing remarkably well.
The so-called Southern Surge came about because the red states built a reading curriculum based on science, not ideology. Schools provide clear accountability information to parents and give them more freedom to choose schools. They send coaches to low-performing classrooms. They use high-quality tutoring, and they don’t promote students who can’t read.”
The idea that the red states could be doing a better job of educating now is counterintuitive to me. The red south states are known for book banding and eliminating social justice teaching, yet their students are doing better with the basics: reading, writing and arithmetic. Maybe both can be true?
To me, the solution isn’t rocket science. In the “good old” days there were consequences. It was expected that if you didn’t meet the standard, you flunked, went to summer school, not graduating was an option.
There is a deeply cynical reason the White House Destroyer loves the poorly educated. And even liberal leaning SoCo is giving the Destroyer the low information electorate he loves and needs.